
Hello people! How are you? I am great, as usual. Troubles in life come when we believe the myth that the grass is greener on the other side of the fence. We are taken over by envy, believing that other people have the good stuff and then feeling depressed, anxious and persecuted by the belief that we have so little. We are taken over by greed, wanting more and more feeling that what we have cannot ever be enough (Psychology Today). In life, on a personal level, it would be good to listen to these people’s advice and be content with what you have but in business you should find out why the grass is greener in the competition’s yard and then make the required adjustments that will ensure that you will end up being better than the competition. A key area to analyse in this respect are the products as a product is usually the main reason why companies are in business. You want to establish why the customers prefer your competition’s products which result in them shopping there. To this end preference testing should be used.
The exercise that we are going to conduct is also an example of the level at which you should operate if you are to gain and maintain a competitive advantage over your competition. You should know your products intimately so we are going to be getting quite technical. If not the whole company then at least your sales people should be on this level of preference testing, at least.

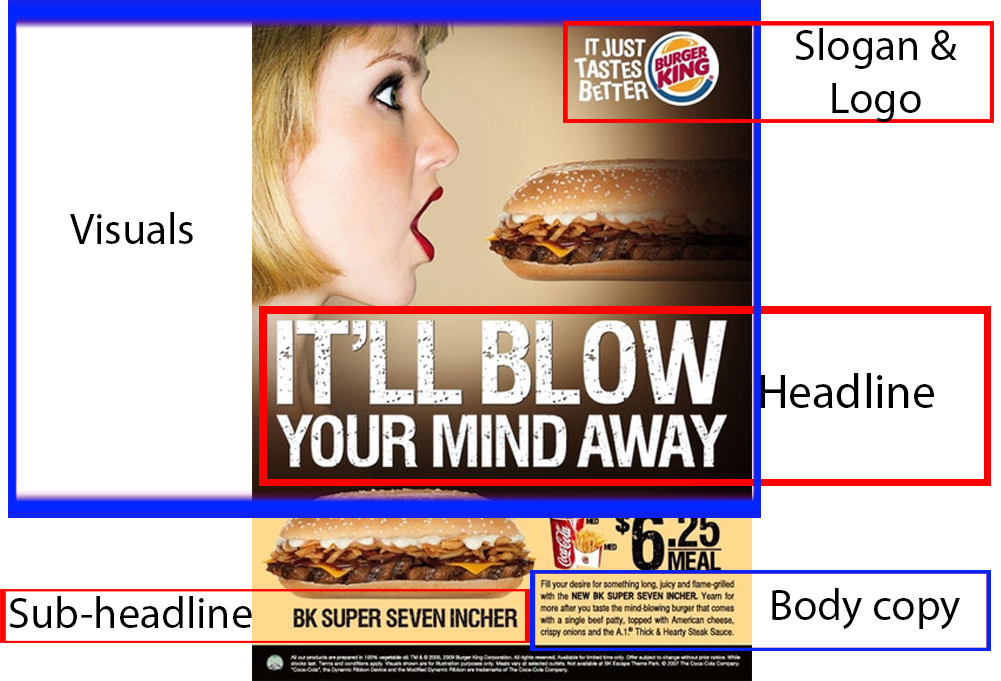
Results from preference testing. (Source: American Physiological Society)
Preference testing is an analysis wherein consumers are asked to express a preference between rival products, like, at least 2 candy bars (Psychology Today).
So I was in Joina City because I wanted to buy a phone charger at the Samsung shop. I use an HTC mobile phone but I had been forced to look for an original charger because the quality of the chargers being sold on the street are now so bad that your battery actually loses power instead of gaining power when you are charging it. To my surprise instead of finding the Samsung shop there was now Coloursel Furniture. I then thought to myself, how is Coloursel, in its new fancy location, going to become better than the likes of TV Sales and Home? It was time to conduct some preference testing.
Coloursel Furniture – Already on promotion (Source: Coloursel Furniture)
As you can see they are already playing the promotion game. That might work but I prefer a less obvious, cheaper, smarter and arguably more effective strategy. In marketing you will sustain a competitive advantage for longer if you use a strategy that is harder for the competition to fathom. A promotion is so obvious. In this case I would look to establish whether or not Coloursel can compete with TV Sales and Home in terms of products by means of conducting preference testing.
So, let us create a scenario to illustrate how this would be done. Please note that in real life this process is much more complicated and more variables are considered other than just two products. After conducting some industrial espionage we discover than the Samsung 48 inch LED television (TV) is TV Sales and Home’s (TSH) best-selling TV having pushed 61 units in April 2016. For Coloursel the best-selling TV which is seen as a direct rival to the Samsung is the Sony Bravia which pushed 33 units in April 2016. We want to know why this is happening so we can make the right changes to our marketing strategy.
Samsung TV (Source: Digital Trends)
You can approach the customers from TSH and conduct preference testing between the Sony that you are selling and the Samsung. If the results point to the customers preferring the Samsung then you will have to consider tweaking your product range in your strategy. If you find out that the customers prefer the Sony (but are still buying the Samsung) you will have to analyse and see where else TSH is gaining its competitive advantage from.
So, what do you compare between two TVs? Let us see.
Before getting to the opinions of TSH’s customers you can get the views of independent experts to get what is called a ‘Smart Rating’ which comprises of the following aspects:
Expert Ratings: These are the ratings from the various technology experts that you can find on Google. The experts are CNET, PC Magazine, Wired Rating, What Hi-Fi, Reviewed.com, TechRadar, 4K
Technical Specifications:
- Vertical resolution – The number of rows, dots or lines from top to bottom on a printed page, display screen or fixed area such as one inch. This affects the quality of the display.
- Screen technology – Whether it is light emitting diode display (LED); Liquid Crystal Display (LCD) etc.
- Refresh rate – This is how often the TV changes the images on the screen. The higher the rate, the better the viewing experience
- Response time – It is the speed at which the LCD panels twist to block and allow light to pass. It is measured in milliseconds (ms) with a lower change meaning faster change between active and inactive pixels and resulting in less image artefacts. The lower the response time the better.
- HDMI ports – The more the better so that you can use different gadgets like your DSTV decoder and your gaming console at high resolution.
- Estimated annual energy use – The lower the better considering that most households now use ZESA’s prepaid electricity system
When you have conducted this analysis you will have a good idea of which TV is better technically. But the most important bit is to hear what the customers think as with customers their perception is their reality. We move on to the next section.
Smart Ratings
Sony – 88/100 <> Samsung – 90/100
The difference is negligible but it is a source of competitive advantage nonetheless.
Sony (0) – (1) Samsung
Price
Sony – $1200 <> Samsung – $1450
This does not mean that the Samsung wins. Ask the customers which price they think is better and why. Some factors that can affect the customers’ perception of a price are:
Cultural factors – culture; sub culture; social class
Social factors – reference group; family; roles and statuses
Personal factors – age and life cycle stage; occupation; economic circumstances; lifestyle; personality
Psychological factors – motivation; perception; learning; beliefs and attitudes
If you understand a person’s purchasing decision based on the factors above you will make the right adjustments to your pricing strategy.
Anyway most of the respondents stated that they preferred the Samsung’s price as it comes with status that they are willing to pay for.
Sony (0) – (2) Samsung
TV Type
Sony – 3D, Smart
Samsung – 3D, Smart
All the customers stated that they do not need 3D. However, most of the respondents stated that they preferred Samsung’s smart capabilities because they can be used in Zimbabwe e.g. Netflix. On the Sony these applications were blocked by IP Address meaning that in Zimbabwe the Sony is actually not ‘smart’.
Sony (0) – (3) Samsung
Screen Size
Sony – 50 inches <> Samsung – 48 inches
This is Zimbabwe and here bigger is better as we associate that with value. Here the answer was attained by asking the respondents the question ‘In terms of screen size which TV do you prefer?’ This is an example of simplified preference testing.
Sony (1) – (3) Samsung
Price per Inch
Sony – $23.98 <> Samsung – $30.19
Such a question would be used as a secondary check on the aspect of ‘Price’ that was mentioned at the beginning of the test. If customers give an answer which is not the same as the one under ‘Price’ then you might want to consider making a stronger case for the Sony based on its value for money as the difference in pricing might actually be wider than one would think at first glance. Take a look at the example below:
Price difference – The Samsung costs 20.83% more than the Sony
Price per inch difference – The Samsung costs 25.90% more than the Sony
This could reduce the customers’ perception of the Samsung’s value for money versus the Sony pushing sales for the Sony. In this case the greater margin swayed the respondents towards the Sony.
Sony (2) – (3) Samsung
Screen Technology
Sony – LED LCD <> Samsung – LED LCD
The two are at par and when asked if there seems to be a difference in the type of picture that they were seeing the majority of the respondents said no.
Sony (2.5) – (3.5) Samsung
LCD Backlighting: A backlight is a form of illumination used in liquid crystal displays (LCDs) as LCDs do not provide light by themselves. They need illumination to produce a visible image.
Sony – LED Edge-Lit: The back lighting is around the edges of the screen and it uses guides to move the light across the whole back panel. It is cheaper to make as it uses less LEDs.
Samsung – LED Back-lit: The LEDs are directly beyond the panel. More LEDs are used and as a result it is more expensive to make, but the type of picture that s created is usually more vibrant.
Although the respondents were not given this information the vast majority preferred the picture of the Samsung when they were asked the question ‘which of the TVs provides a more vibrant picture’. We now know why.
Sony (2.5) – (4.5) Samsung
Refresh Rate: This is how fast a TV switches between images
Sony – 480 Hz <> Samsung – 480 Hz
We asked the respondents which TV gives a smoother picture after playing them a car chase with quick sequences from Furious 7 on DStv. The respondents did not notice a discernible difference between the two TVs
Sony (3) – (5) Samsung
Other Features
Sony – Has child lock; It does not have optional WiFi with dongle
Samsung – No child lock; Has optional Wi-Fi with dongle
According to the respondents the child lock option does not help on the Sony as one cannot view free to air programs on it. The issue of the dongle also does not matter here as the smart applications are also blocked on the Sony.
On the Samsung the lack of child lock does not matter as this can be done on the DSTV decoder. Dongles are more popular in Zimbabwe than WiFi routers so this feature was appreciated by those who use the Netflix application, for example.
Sony (3) – (6) Samsung
Internet Compatibility
Both TVs can download shows from the internet through the web browser. The Sony’s web browser is not blocked apparently. Let us see how they fare when it comes to applications.
Sony – Amazon Video on Demand; Crackle; Facebook; Hulu, Netflix; Vudu; Web Browser; YouTube – None of them work as they are blocked through IP address detection.
Samsung – Amazon Video on Demand; Crackle; Facebook; Hulu, Netflix; Vudu; Web Browser; YouTube – All of the applications work although respondents are mostly concerned with YouTube and Netflix
Sony (3) – (7) Samsung
There are many other dimensions that we can look at in this case of preference testing such as connectivity, physical specifications and energy efficiency among others. Up to this point I am sure you now have an idea of why people are buying the more expensive Samsung. The Samsung is, in the eyes of the customers, worth the price. In this case, ceteris paribus, the grass is greener at TSH because they are selling a better product. At this point you can start making decisions on how you can make adjustments to your marketing strategy. Tactics can include also selling the same type of TV or in the case that you want to compete on price you can bring in a TV with the same attributes as the Samsung but at a lower price, such as a Vizio.
Through preference testing you now know why the customers are behaving the way that they are. More importantly you will now know what to do in order to make your grass greener. You have to really dig deep in terms of comparing products so as to discover sources of competitive advantage. Such an approach will also make it harder for your competition to copy your methods. Do you think that preference testing can help you to close (or widen) the gap between the gap between you and your competitors. Let me know in the comments section below.
Thanks
Ruvimbo

Leave A Comment