
Hey guys! I hope that you are well. The series continues today and we are talking about the Marketing Implementation System aka the Marketing Implementation Plan. This is a detailed listing of the activities, costs, expected difficulties, and schedules that are required to meet the objectives of the strategic plans (Business Dictionary, 2016). As you can see I have borrowed that definition from strategic planning. Anyhow this function/concept is responsible for ensuring that the activities that you will have created using your Marketing Planning System will actually be carried out in an efficient and effective manner. For the purpose of time we will concentrate on the skills that you will require as a person in order to run the Marketing Implementation Plan properly and then we will demonstrate how you can use a tool that is critical when you are conducting this activity, the Program Evaluation and Review Technique.
The Skill Set That You Will Require In Order To Run a Marketing Implementation Plan

An Anti-Coca Cola Campaign (Thought Pursuits, 2014). One of many I should say. I am sure that you have come across talk of Coca Cola containing acids that are harmful to your body. I am sure that is bad for business. So, where did this problem emanate from?
In order to run a marketing implementation plan effectively you have to possess the skills below. Within yourself or within your team. Let us see why below.
- Diagnostic Skills: A few years ago a lady friend of mine was suffering from a condition were she was having irregular periods. The doctor gave her birth control pills and this regularised everything. Another problem came up when she got married, she had difficulty conceiving. They went to another doctor and they found out that she had been born with a condition in which her hormones were severely imbalanced. When the doctor went through her medical history he pointed out that the birth control pills that she had been taking had actually worsened the situation (hormonal imbalance) over time. The doctor who had given her the pills had addressed the symptom which was the irregular periods but not the problem which was hormonal imbalance. Now she had to deal with the potential repercussions of compromised fertility which had been caused by an incorrect diagnosis. Diagnostic skills are the knowledge and skills required in identifying and understanding cause-and-effect relationships between symptoms and their underlying source(s) (Business Dictionary, 2016). You will execute your marketing implementation plan more effectively if you possess these skills as you will know, critically, where the problem really lies in various situations as opposed to just looking at the symptoms. Making the wrong diagnosis could have consequences as you will set off in the wrong direction like my lady friend did.
- Identification Of Company Level: You have to know at what level a problem is occurring in your marketing system in order to ensure that the effective implementation of your marketing plan is not compromised. Me, I love Coca Cola. It’s got this zing and an original taste that I can’t describe. When you drink it the fizz gives you a sense of euphoria. Growing up I had to drink it in secrecy though as my mother told me that Coca Cola contained acids that were bad for my health, bleh! A lot of people share this sentiment in Zimbabwe and it really harms Coca Cola as far as the under 20 year’s segment of the market is concerned. If I worked at Delta I would need the skill of ‘Identification of Company Level’ to deal with this negative perception. I would have to identify whether or not the problem is occurring at the marketing function level (the marketing plan, marketing research, product development etc.), the marketing program level (advertising, promotion, distribution etc.) or the marketing policy level (basically these are the rules which govern your marketing activities e.g. we will not market directly to 12 year old children because they are not yet mature enough to make decisions on their own, that type of thing). Now, Coca Cola has addressed this ‘acid’ issue through various channels. I will give this example from Coca Cola UK were they explained why they use phosphoric acid in their drinks. And I quote, ‘Phosphoric acid is used as a preservative in a variety of food and drinks. We add a very small amount to some of our soft drinks, such as Coca‑Cola, Diet Coke, Coke Zero and Dr Pepper, to give them their tartness. It is a safe food ingredient approved by national health authorities in all the countries where Coca‑Cola is sold. Phosphoric acid contains a small amount of the mineral phosphorus, which is found widely in nature and plays an important role in how our bodies get energy. It is also a major component of bones and teeth. You can find phosphorus in foods like chicken, tomatoes, meat and fish.’ On this evidence you can tell that it is not a marketing policy problem as they market goods that are safe for consumers. A quick look at a Coca Cola bottle from Delta Beverages would tell you that this is a marketing function and marketing program problem. I took a look at a bottle of Coca Cola at the canteen and realised, for example, that there was no information on the ingredients in the bottle. This is a marketing function problem as product development is covered under that level. For example the product development function should have ensured that such critical information was available on the package so that people would not make up stories that damage the brand. Armed with this knowledge I would then make the right moves. I would then start a campaign to educate people about the acid in the Coca Cola thus solving the problem at the marketing program level
- Implementation Skills: The types of abilities that are required under this heading are allocating skills for budgeting resources, organisational skills to develop an effective organisation and interaction skills that are required to motivate others to get the job done according to the conditions set in your marketing implementation plan. Self-explanatory right? If not let me know in the comments section.
- Evaluation Skills: This is basically the ability to monitor activities and keep things on track according to your marketing implementation plan. We touched on control in the last article under the section 4 titled ‘Control’ and we will talk about it in the next article so I will not dwell on it much here.
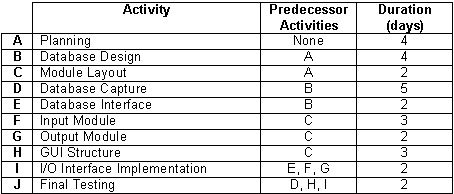
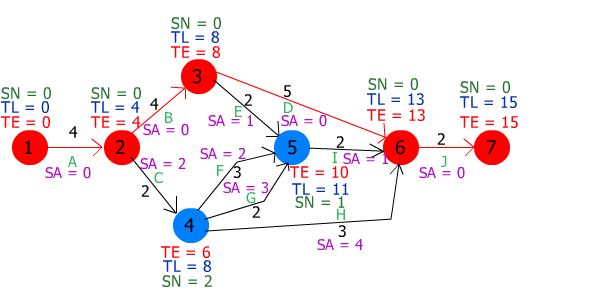
The Program Evaluation and Review Technique (PERT) (Du Pont, 1957) is in action here. The table on top is a list of activities that a small software company has proposed to schedule for a client project. The diagram on the bottom is the flow chart itself. The main aim of using PERT is to complete a project in the best way, in the shortest possible time, according to a marketing implementation plan
Now, one of the main aims of a marketing implementation plan is to complete a project in the shortest possible time. To this end I will introduce you to my pet, PERT. This is another great alternative to the control tools that I mentioned in earlier articles. I prefer using this tool to ensure that everything goes well when I am implementing a marketing strategy. When you use the PERT you will know the following: a) The shortest amount of time that can be taken to complete a project b) The longest amount of time that it will take to complete a project c) The amount of time that an activity can be delayed past its earliest start or earliest finish time without delaying the project. Some of the benefits of PERT are:
1) Activity Analysis: A project manager views information about the likely completion of a project on time and on budget by viewing PERT activities and events independently and in combination. For example, software implementation requires the completion of critical activities such as hardware installation, programming, system testing and end-user training. Using a PERT chart, a project manager can evaluate the time and resources needed for any one of these activities, such as program installation. The project manager can also evaluate the sum requirements of all activities simultaneously, from hardware installation to end-user training.
2) Department Coordination: PERT analysis improves planning and decision-making by integrating and presenting data from multiple departments. Gathering qualitative and quantitative data from multiple sources also helps coordinate project activities and improves communication among departments. PERT identifies responsible departments and each person’s project role. The visibility of areas of responsibility encourages management commitment to the project. In addition, PERT reveals activity inter-dependencies and contributes to the development of a master plan that provides a current view of business operations. PERT analysis improves planning and decision-making by integrating and presenting data from multiple departments. Gathering qualitative and quantitative data from multiple sources also helps coordinate project activities and improves communication among departments. PERT identifies responsible departments and each person’s project role. The visibility of areas of responsibility encourages management commitment to the project. In addition, PERT reveals activity inter-dependencies and contributes to the development of a master plan that provides a current view of business operations.
3) What If Analysis: PERT requires that project activities be sequenced in a network under a set of rules specifying critical and sub-critical paths. The critical path is the longest sequence of activities and events — milestones — in the project, and determines the number of days required to completion. A what-if analysis identifies possibilities and uncertainties related to project activities. Different permutations and combinations of activities are tried, and the most useful possibility selected, minimizing project surprises and waste. The what-if analysis also highlights the activities with the greatest project risk that require careful monitoring during the project. (Small Business Chron, 2016)
Right. Things could get a little complicated from here on out. I am going to explain how the activities in that PERT chart above turned into that spaceship that I called the flowchart. As I lay down the steps try to do it yourself on the side and see how it comes out. If you face problems, let me know in the comments section.
- We will start with the first node, we will call it node 1 (the circle labelled ‘1’)
- Let’s add activity A to the network. It is the first activity because it does not have any predecessor activities
- We will label this arc with the length of activity A (on the PERT chart), 4 days (the green A and the 4 on top of it in the diagram)
- We will add a second node, indicating that activity A is complete
- Now we will look at activity B. It cannot be started until activity A is complete. We will start activity B at node 2, and will label it with its duration
- We indicate the completion of activity B with node 3
- Activity C cannot be started until activity A is complete. Let’s add activity C to the network
- Now let’s look at activities D and E. They both begin after the completion of activity B. Let’s add them to the network
- Next we will look at activities F and G. They both begin after the completion of C
- Also note that E, F and G are predecessor activities for activity I. For this reason, we will terminate these three activities at the same node
- Now let’s add activities H and I to the network. H begins after C is complete and I begins when E, F and G are complete
- Also note that the predecessor activities for J are D, I and H. We will terminate H and I at the same node as D, node 6
- The last activity is activity J. As mentioned, J begins when D, H and I are completed. Let’s add J to the network
- At node 7, all activities are complete. We can now begin to solve the problem
- In step one we will do a forward pass to determine the earliest time each node could be reached, TE (check for the red TE on the flowchart above)
- By definition, TE of the start node is 0
- For the other nodes, TE = max[ (TE at tail of arc)+(duration of arc)] of ALL of the arcs entering the node. We calculate this for all of the nodes
- Node 2: TE = max[(0+4)] = 4. So add Node 2 TE = 4
- Node 3: TE = max[(4+4)] = 8 so TE = 8
- Node 4: TE = max[(4+2)] = 6 so TE = 6
- Node 5: TE = max[(8+2),(6+3),(6+2)] = 10 (since 10 is the biggest value there) so TE = 10
- Node 6: TE = max[(8+5),(10+2),(6+3) = 13 so TE = 13
- Node 7: TE = max[(13+2)] so TE = 1
- I am sure that at this point we are still together. We have now found the answer to our first question. The shortest possible time to complete this project is the TE of the seventh node, 15 days. Now to answer the second question which is, ‘What is the latest possible time that each node can be reached, TL?’ (Can you see the TL‘s in blue in the flowchart above? Those are the ones we are going to calculate now)
- By definition, TL of the last node is equal to TE. So TL at node 7 is 15
- For the other nodes, TL = min[(TL at head of arc)-(duration of arc)] of ALL of the other arcs leaving the node. We will calculate this for all of the other nodes
- Node 6: TL = min[(15-2)] = 13 so TL = 13
- Node 5: TL = min[(13-2)] = 11 so TL = 11
- Node 4: TL = min[(11-3),(11-2),(13-3)] = 8 so TL = 8
- Node 3: TL = min[(13-5),(11-2)] = 8 so TL = 8
- Node 2: TL = min[(8-4),(8-2)] = 4 so TL = 4
- Node 1: TL = min[(4-4)] = 0 so TL = 0
- In the next step, we will calculate the node slack time, SN (Green in the flowchart above). As this term does not seem to be self-explanatory I will take the time to define what it is. Slack time for an activity is the time between its earliest and latest finish time. Slack is the amount of time that an activity can be delayed past its earliest start or earliest finish time without delaying the project. (Du Pont, 1957). SN = TL – TE. We will calculate this for each node
- Node 1: SN = (0-0) so SN = 0
- Node 2: SN = (4-4) so SN = 0
- Node 3: SN = (8-8) so SN = 0
- Node 4: SN = (8-6) so SN = 2
- Node 5: SN = (11-10) so SN = 1
- Node 6: SN = (13-13) so SN = 0
- Node 7: SN = (15-15) so SN = 0
- So now you will know how much slack time you will have at each stage. This will help especially when ‘things come up’ you will know exactly where you stand. Now we are going to calculate what is called the total arc slack time, SA (The one in purple on the flow chart). SA = (TL of the node at the arc’s head) – (TE of the node at the arc’s tail) – (arc duration).
- Activity A: SA = 4 – 0 – 4 so SA = 0 (For Activity A the node at the arc’s head is node 2 and the node at the arc’s tail is node 1)
- Activity B: SA = 8 – 4 – 4 so SA = 0
- Activity C: SA = 8 – 4 – 2 so SA = 2
- Activity D: SA = 13 – 8 – 5 so SA = 0
- Activity E: SA = 11 – 8 – 2 so SA = 1
- Activity F: SA = 11 – 6 – 3 so SA = 2
- Activity G: SA = 11 – 6 – 2 so SA = 3
- Activity H: SA = 13 – 6 – 3 so SA = 4
- Activity I: SA = 13 – 10 – 2 so SA = 1
- Activity J: SA = 15 – 13 – 2 so SA = 0
- We will now take all the information that we have to find the critical path. Connect all of the nodes at which SN = 0 via the arcs at which SA = 0. The critical path becomes node 1 > node 2 > node 3 > Node 6 > node 7. Those are the nodes that are marked in red in the diagram above
That is the critical path. The activities on this path A, B, D and J must be completed on time in order for the project to be completed in the shortest time possible in line with the best practices of a marketing implementation plan. There is the tool that you can use to decide whether or not John can take a day off in the middle of a critical (marketing) project. This tool can be used for any project. I use it in the marketing implementation plan as it ensures that things are done on time every time without the possibility of the team overlooking anything. If you can implement your strategy quickly and correctly you will make your customers happy. If you implement your marketing strategy in the shortest possible time you will save on costs and improve your profit margins. phis makes the marketing implementation plan pretty handy right?
So, that’s it for this edition guys, I hope that you enjoyed and that you learnt as much as I did. It is one thing creating a marketing strategy. Implementing it is a totally different ball game and implementing it the wrong way or in an inefficient way will lead to you not meeting your objectives Ensure that you include a marketing implementation plan. So 1) Choose a team with members that have the skills that we mentioned above and 2) Ensure that you use the PERT as part of your marketing implementation plan to save on costs, to improve on project completion times and to basically cover all the angles.
Thanks
Ruvimbo


Thank you for the information , am now a follower of your articles
Thank you very much for the compliment. I will continue to produce more articles.